The importance of data in metal additive manufacturing cannot be overstated. It is data—derived from materials, hardware, process and more—that enables additive manufacturing companies and users to improve the technology and its output, to streamline workflows and achieve greater efficiency. But data can be notoriously difficult to navigate and visualize, which makes it challenging to transform it into actionable insights. AddUp, a global metal additive manufacturing company that was formed out of Fives and Michelin, aims to make 3D printing data more accessible for its metal AM systems through its new AddUp Dashboards software, released in February 2022.
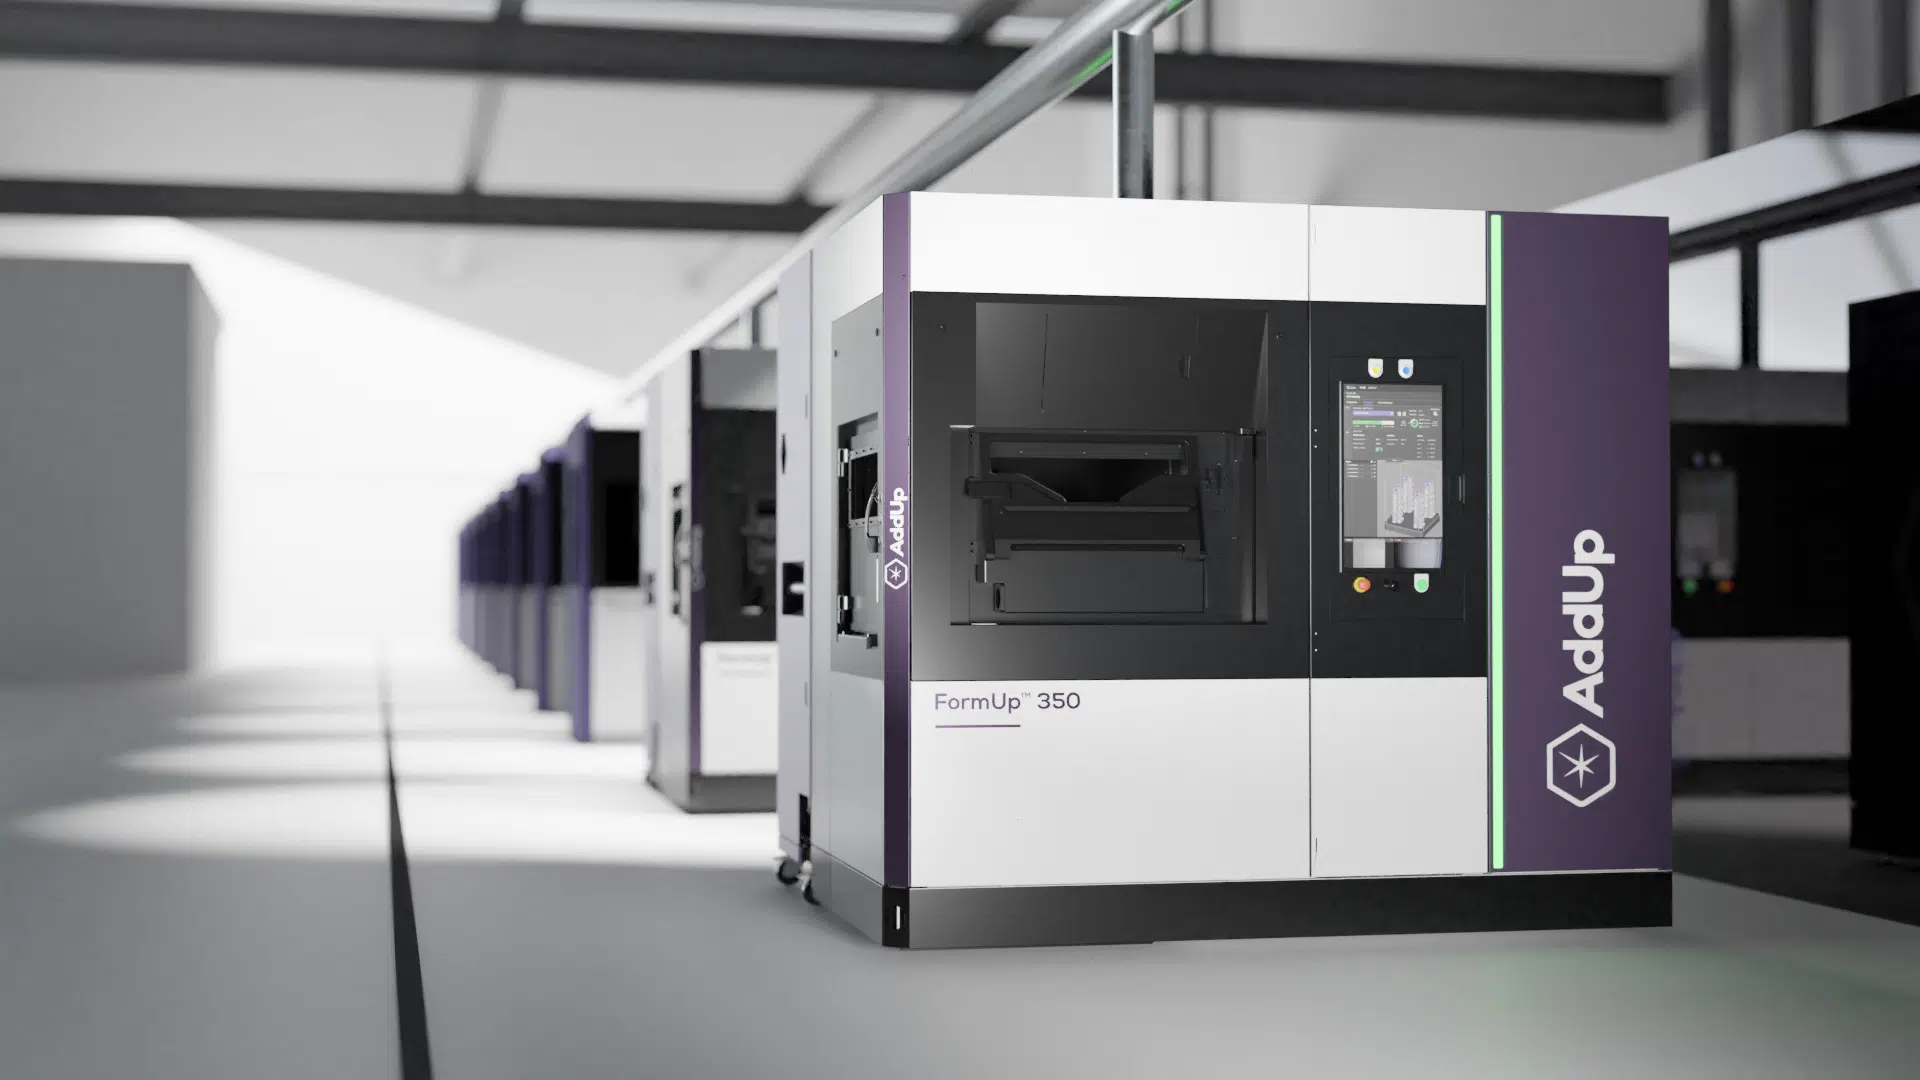
AddUp Dashboards is a multi-scale monitoring software that is available with all AddUp 3D printing systems, including FormUp powder bed fusion (PBF) machines and BeAM directed energy deposition (DED) systems. The software was developed specifically to enable AddUp customers to easily access detailed process data through an intuitive and highly customizable platform. Check out this video to see how the software works.
Real-time and historical process data
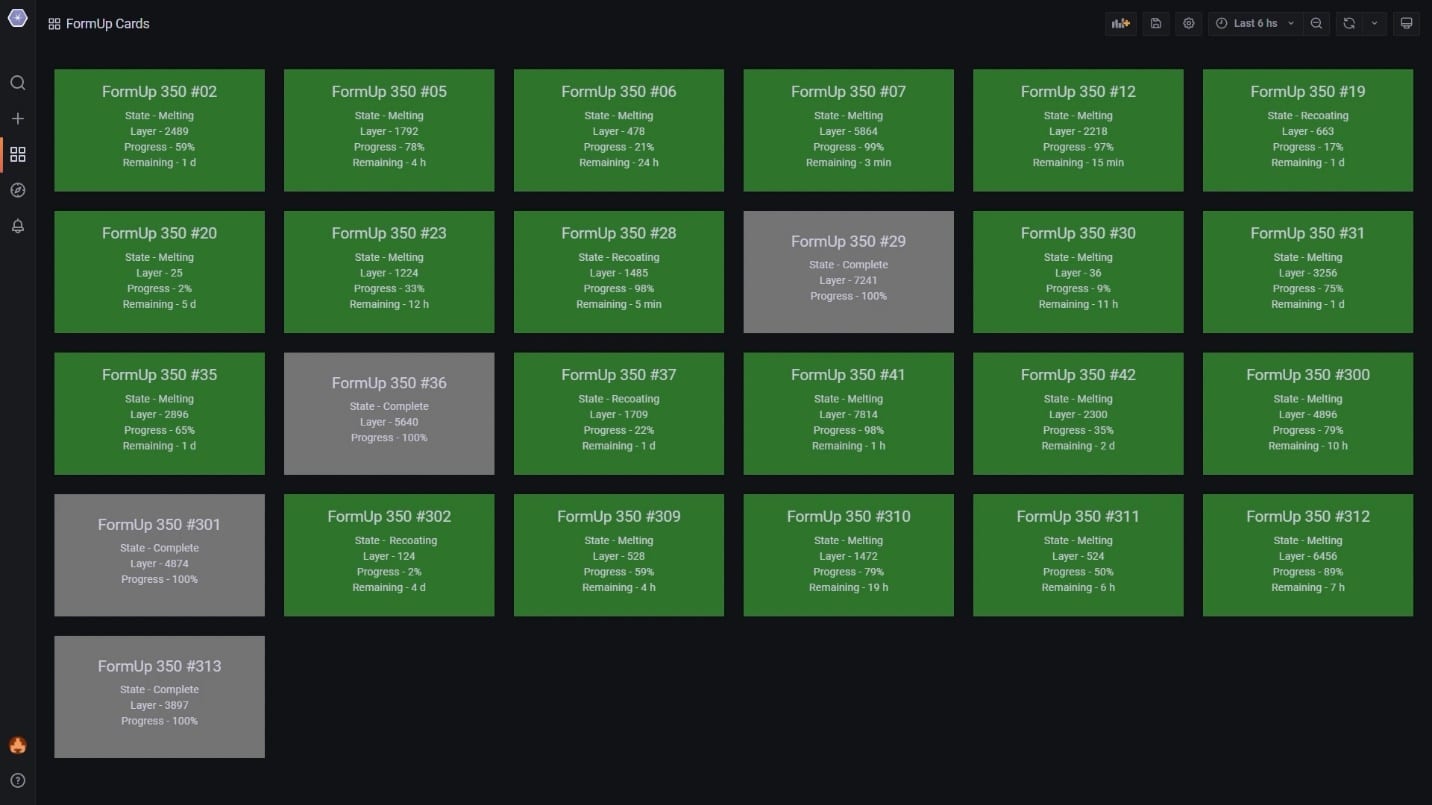
The new software program has been in development for more than a year at AddUp and the company is now ready for its customers around the world to benefit from its insights. AddUp Dashboards itself is programmed to continually collect data from all networked systems, regardless of where they are located. In a demonstration of the software, I was shown how data is readily available for AddUp’s systems in France as well as those at its American facilities. The number of machines that can be monitored via the software is also unlimited, meaning users can easily add or remove printers from their dashboard as they scale their operations.
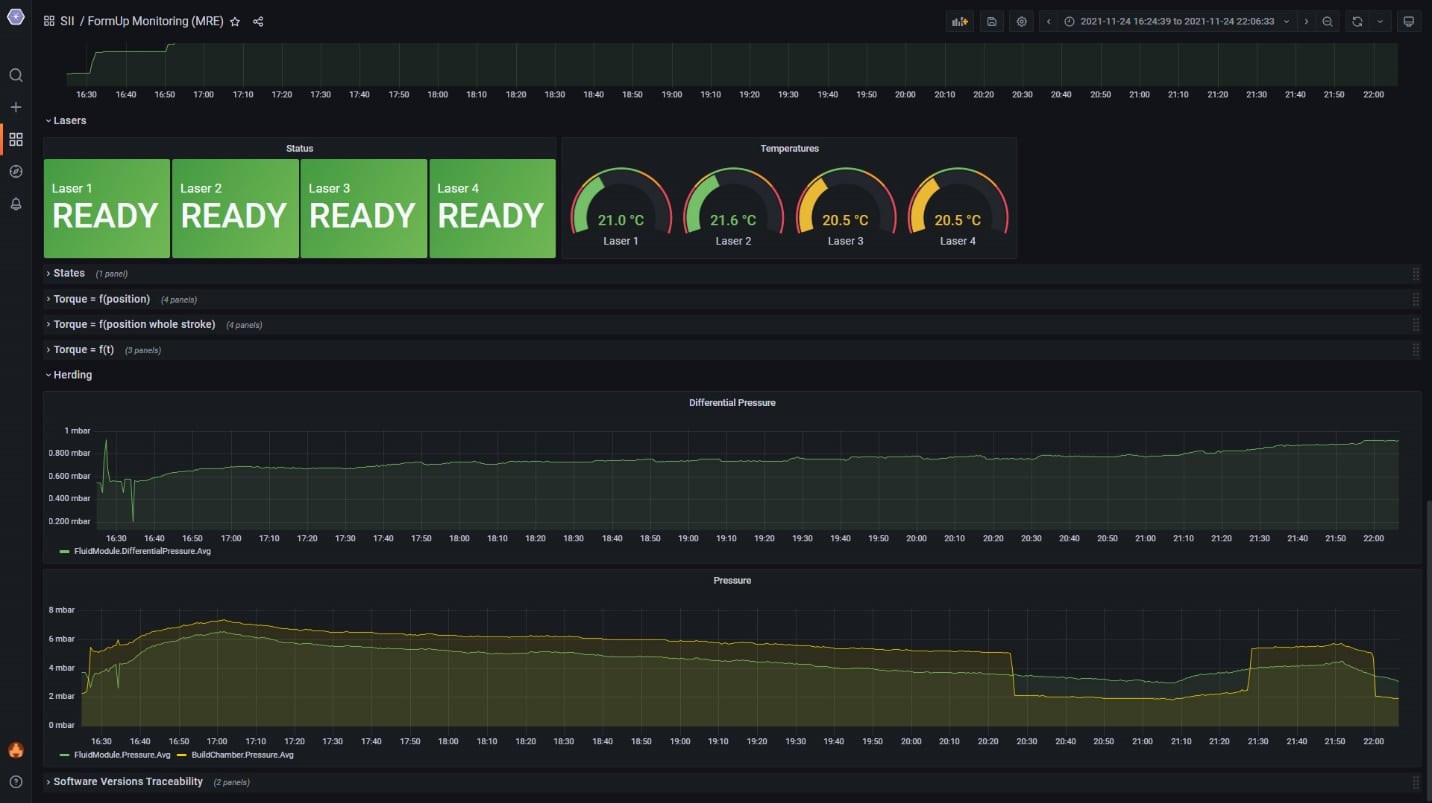
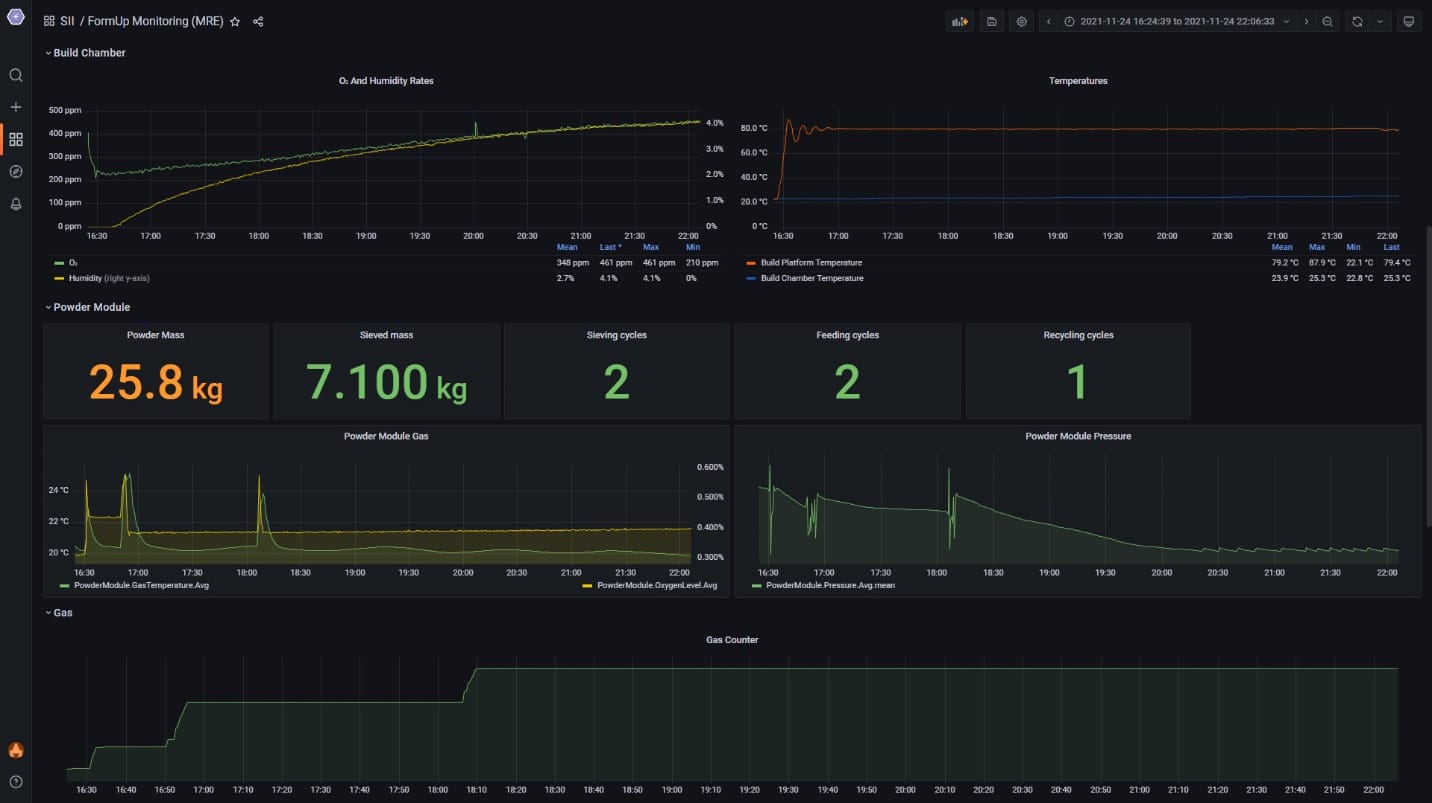
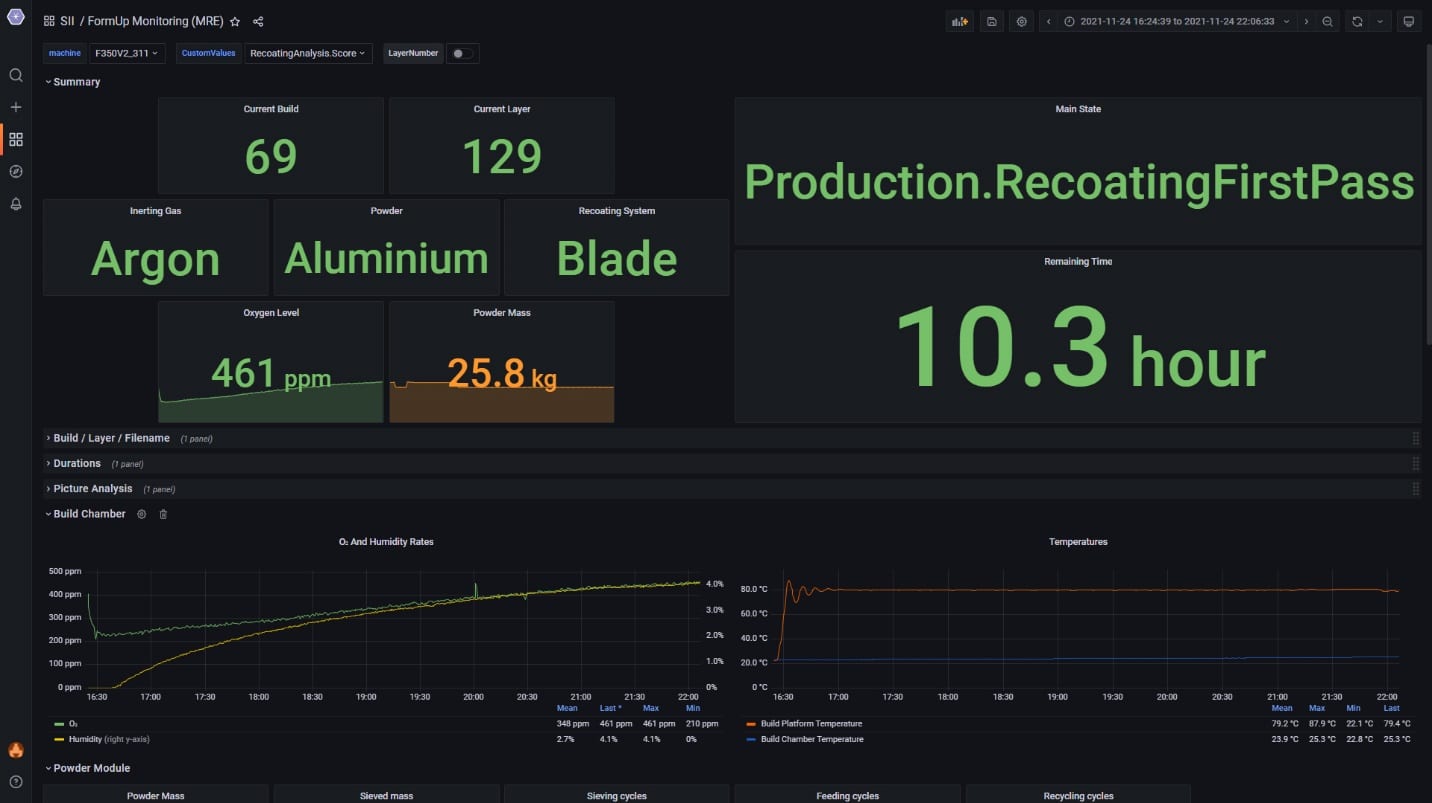
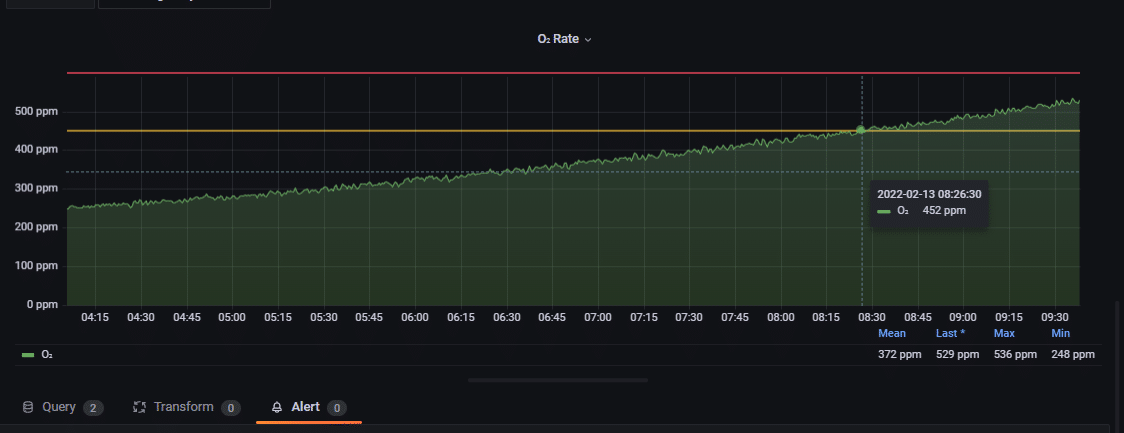
The Dashboards solution actually comprises two software programs: a web-based one through which AddUp users connect to a server; and the 3D printer’s software. The web-based platform therefore receives data collected directly from the machines in real time (with a refresh rate of just five seconds). This means users can monitor the current state of a print job—including how many layers have been printed and how much print time remains—as well as visualize any other metrics related to the hardware, materials or process, including oxygen levels in the build chamber, humidity levels, powder levels and more.
Notably, AddUp Dashboards isn’t only a tool for real-time process monitoring. The software also stores all the data collected, providing in-depth historical process data for every connected machine. Looking at the historical records of an individual 3D printer, you can see when the machine was first connected and basic information like how many print jobs it has completed.
But the data also goes well beyond this. Users can visualize the process for each historical build, down to the individual layers. Users can track things like the melting and recoating durations for a given print, as well as post-melting delays, which indicate how long after a print is complete it can be removed from the machine’s build tray.
For machine maintenance purposes, historical data related to powder spreading and recoating is particularly useful. Metrics like drifts and torque are measured for every single moving element of the 3D printer, which gives maintenance technicians the data they need to understand when a machine needs work before major maintenance is required. For example, FormUp PBF systems integrate dual recoating drawers for faster powder recoating. With Dashboards, printer maintenance teams can track the performance of these drawers to better anticipate if and when an issue will arise.
Additionally, the software keeps track of every single software version used in association with a given AM machine. Users can easily pull up a past print project and see what firmware was used for the lasers, what version of software the printer was using at the time and more. For sensitive applications like those in the medical industry, this insight can be particularly advantageous.
Of course, most of this data is related to the powder bed fusion process. For AddUp’s BeAM DED machines, there are other types of metrics to monitor, like what G-codes the machine has processed.
A fully customizable platform
In the AddUp Dashboards software demo, one thing that is abundantly clear is how adaptable and customizable the solution is. For one, for every metric available, users can choose from over 25 data visualization styles, including graphs, heat maps, text, etc. Data panels can also be resized, moved and duplicated with the click of a mouse to ensure that the dashboard and its contents suit the users needs.
Manufacturing on Demand
Other seemingly small aspects, like colors and text size, can also be tailored to the user’s preference. This can improve AddUp Dashboards’ integration with other established systems and processes. For example, if the color blue is used elsewhere in an organization to indicate that a project is complete, Dashboards can be set to match, with a blue box indicating that a print is complete.
Perhaps most importantly when it comes to customization is the Dashboards alert system. Users can set alarms so that they are alerted via email when a certain threshold has been passed. For example, the software closely monitors over 80 process parameters, gathering production file information, build chamber sensors, machine status and more. Users can choose to automatically be notified if any of these indicators surpass a customizable threshold. This enables them to address potential drift before it becomes a problem.
As AddUp explains it, users can choose to set alerts for many different metrics, like powder levels and remaining print time. If you want to be notified 10 minutes before a print is expected to finish, no problem. Alerts can also be used to notify users of a potential failed print. That is, if any inconsistencies arise during the print process, an alert will be sent, enabling the user to stop the print job if needed, saving time and material costs.
Users can also customize what information is being monitored. AddUp Dashboards provides an extensive list of possible data types and users can choose from a drop down menu which metrics are most relevant to them. From there, it is easy to choose the type of visualization associated with the specific metric, what thresholds to watch for and what color scheme to use.
Different data groups can also be assigned to particular people or teams. For example, maintenance, R&D and print services teams can each access their own dashboards populated with data relevant to them. These dashboards can be restricted so that only relevant users can see them. In terms of access, users can simply login using existing Windows credentials, eliminating the potential for administration problems.
Overall, the Dashboards platform is highly intuitive and user friendly. While the company offers multi-day training modules for its hardware and other software solutions, Dashboards only requires a two-hour instructional session. Even this training is primarily to explain the software’s default settings and how they can be customized. AddUp’s own AM teams have taken to the software, crediting it for changing how they understand and monitor production jobs.
Process data and mass production
AddUp’s new software will play a vital role in the day-to-day operations of the company’s customers. The use of monitoring solutions such as Dashboards during the process could take the place, or at least reduce, the amount of post-production inspections that are needed and provide an increased confidence in build quality.
In compiling data from every connected 3D printer, the software solution provides a fingerprint for every print job executed, comprising details like number of layers, overall print time, build temperature evolution, material consumption, oxygen levels throughout the print and much more. Printed parts can therefore be qualified based on a certain set of very specific data and future production runs for that given part can be evaluated based on the consistency of the process parameters. In other words, once a standard for a part has been set, subsequent units can be compared to the qualified part’s manufacturing parameters. If the fingerprint matches, the need for further testing is significantly reduced. This, in turn, will enable metal AM users to more seamlessly scale production volumes.
AddUp Dashboards is available now. Check out this video for a first-hand look into how the software works.
This article was published in collaboration with AddUp.
* This article is reprinted from 3D Printing Media Network. If you are involved in infringement, please contact us to delete it.
Author: Tess Boissonneault

Leave A Comment